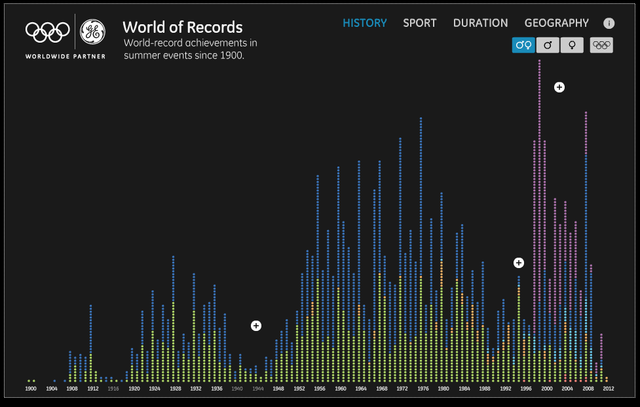
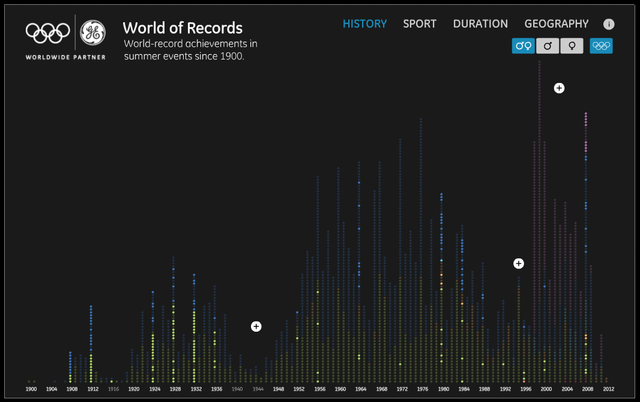
GE recently built a pretty exhaustive showing the history of world records from August 29, 1900, to May 5, 2012. The data visualization displays the number of world records set by year, by country, and by sport. It also offers a tab where you can see the duration of world records and an option where you can view only those world records set at the Olympics. Because the first Olympics was held in 1896 and many early records may not have been recorded diligently, this visualization is not comprehensive. (You would think more records would have been set and broken early in the 20th century.) Still, here's a quick summary of some notable world record facts, by the numbers.
112: Number of world records set in 1999, the most for any year. It was the engaged in an epic home run battle. The average year had roughly 30 world records set.
1914-1918 and 1939-1945: Aside from the first seven years of the century, these periods saw the lowest collective number of world records broken. They were the years of World War I and World War II.
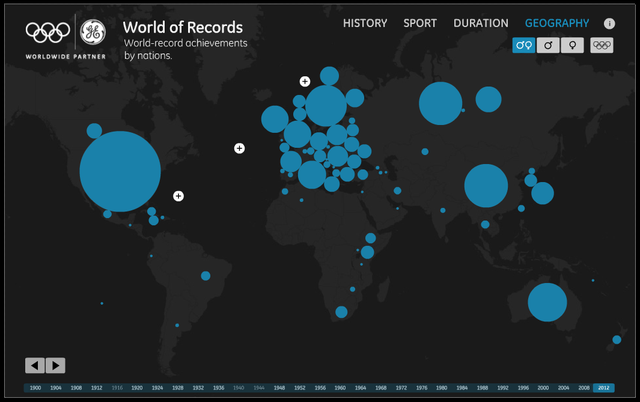
956: World records set by the United States, the country with the highest total. That number represents 28.12 percent of all the world records set. China comes in second as a country, with 277 world records.
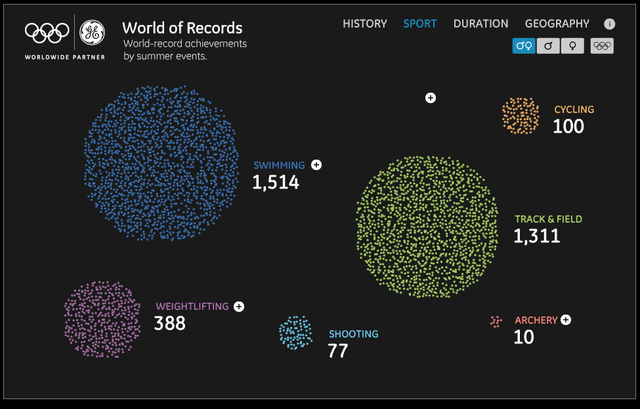
1,514: World records set in swimming, the discipline with the highest number of medals. There were more than 200 more world records set in swimming than in track and field, according to the data visualization. There were records set for 17 events in swimming and 25 events in track and field.
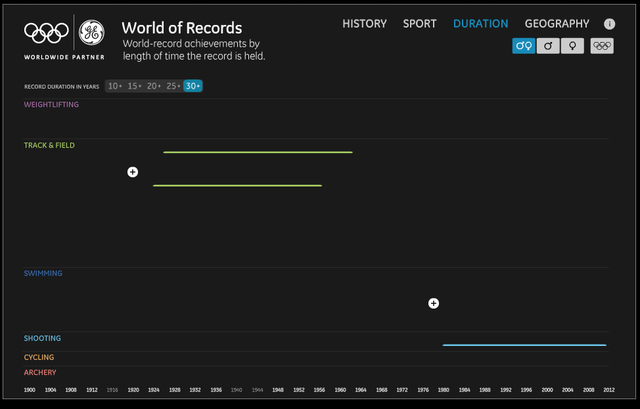
32: Years the current longest standing world record, 581 points in the men's 50m pistol shoot by the Soviet Union in 1980, has remained unbroken.
5: Percent of world records set at the Olympic Games, or 176 out of 3,400 world records overall.
H/T:
—Joe Spring